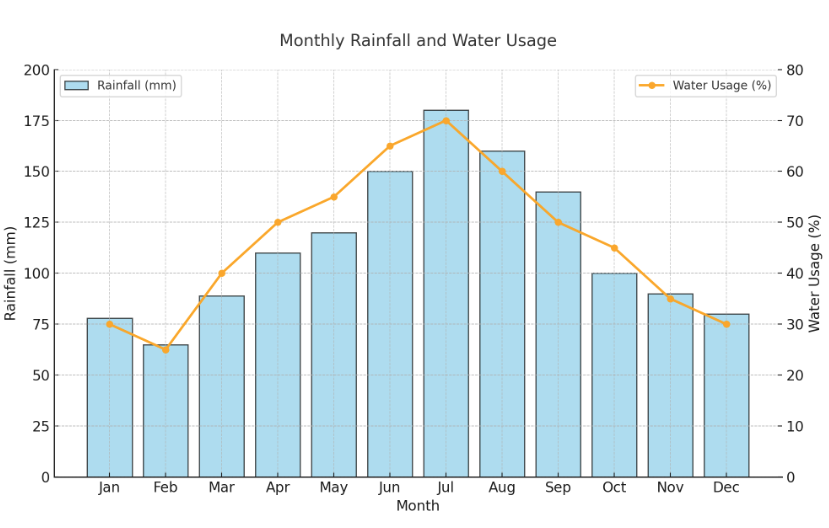
The mixed charts illustrate the monthly rainfall (in millimeters) and water usage (in percentages) in a certain region over the course of a year. The data highlights the relationship between rainfall patterns and water consumption.
Rainfall shows a clear seasonal variation, peaking in July at 180 mm and reaching its lowest level in February at 65 mm. The trend indicates higher precipitation during the summer months, with consistent levels above 150 mm from June to August. In contrast, rainfall remains below 100 mm during the winter and early spring months.
Water usage mirrors the rainfall pattern, with the highest consumption observed in July at 70%. This is likely due to increased agricultural activity, irrigation demands, and recreational water usage during the rainy season. Conversely, water usage is lowest in February at 25%, coinciding with the driest month.
The relationship between rainfall and water usage suggests that precipitation significantly influences water demand. During periods of high rainfall, water is more readily available for both agricultural and domestic use. In drier months, lower usage may reflect either conservation efforts or reduced water supply.
In conclusion, the charts emphasize the importance of managing water resources effectively to balance supply and demand, particularly in regions with pronounced seasonal rainfall fluctuations.
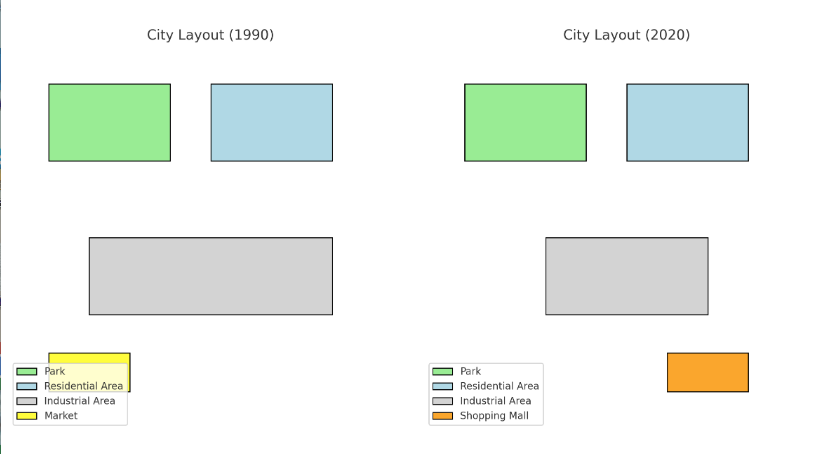
The maps compare the layout of a city center in 1990 and 2020, highlighting significant changes over the 30-year period. The transformations indicate urban modernization and a shift toward commercial and recreational development.
In 1990, the city center featured a large park in the northwest, a residential area in the northeast, an industrial zone in the south, and a market in the southeast. The park and residential area occupied significant portions of the city center, providing green space and housing. The industrial zone was the largest area, reflecting the city’s reliance on manufacturing at the time.
By 2020, notable changes had occurred. The industrial zone was significantly reduced in size, replaced partially by a shopping mall in the southeast. This reflects a shift from manufacturing toward retail and service-oriented industries. The park and residential area remained unchanged, indicating the city’s commitment to preserving green spaces and housing for residents.
The addition of the shopping mall suggests a focus on economic growth and urban convenience, catering to increased consumer demand. Meanwhile, the downsizing of the industrial zone aligns with global trends of deindustrialization and the rise of technology-driven economies.
Overall, the changes demonstrate a balanced approach to urban development, emphasizing modernization while maintaining essential residential and recreational spaces. (208 Words)
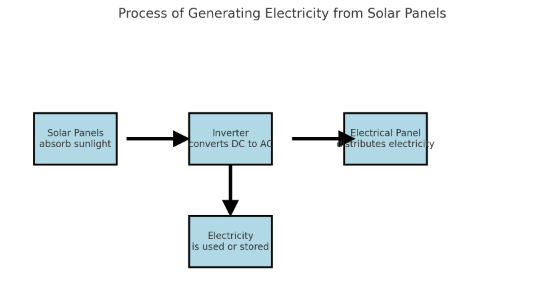
The diagram illustrates the process of generating electricity using solar panels. This system transforms sunlight into usable energy through a series of steps, demonstrating the efficiency and sustainability of solar power.
First, solar panels installed on rooftops or open spaces absorb sunlight. These panels contain photovoltaic cells that convert sunlight into direct current (DC) electricity. Next, the DC electricity flows into an inverter, where it is transformed into alternating current (AC) electricity. This conversion is essential, as most household and industrial appliances run on AC electricity.
Once converted, the AC electricity is distributed through an electrical panel, supplying power to various applications such as lighting, heating, and electronic devices. If excess electricity is produced, it can either be stored in batteries for future use or fed back into the main power grid, benefiting other users.
This process highlights the simplicity and reliability of solar energy systems. By utilizing sunlight, an abundant and renewable resource, this method offers a sustainable alternative to fossil fuels. Additionally, the ability to store surplus energy ensures continuous power supply even during cloudy periods or at night.
In conclusion, solar power is an eco-friendly and efficient solution to meet energy demands while reducing greenhouse gas emissions, contributing to a cleaner and greener future. (207 Words)
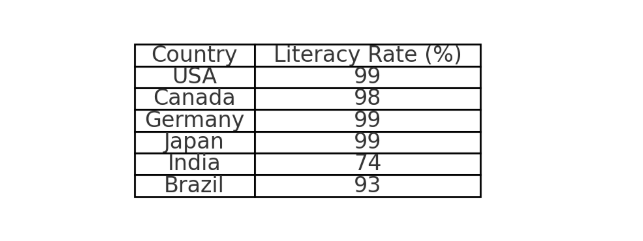
The table compares literacy rates across six countries—USA, Canada, Germany, Japan, India, and Brazil—in 2010. The literacy rate is expressed as a percentage, reflecting the proportion of people who can read and write.
Overall, the developed nations (USA, Canada, Germany, and Japan) demonstrated near-universal literacy, with rates ranging from 98% to 99%. Germany, Japan, and the USA recorded the highest literacy rate at 99%, while Canada followed closely at 98%. In contrast, the developing nations, Brazil and India, showed significantly lower literacy rates, with Brazil at 93% and India at 74%.
This stark difference highlights the gap in educational access and quality between developed and developing countries. In developed nations, government investments, widespread access to education, and advanced infrastructure contribute to higher literacy. Meanwhile, India’s comparatively low rate reflects challenges such as poverty, lack of educational facilities, and gender disparities in schooling, particularly in rural areas.
In conclusion, the data underscores the importance of prioritizing educational development in less-developed nations to bridge the global literacy gap. (166 Words)
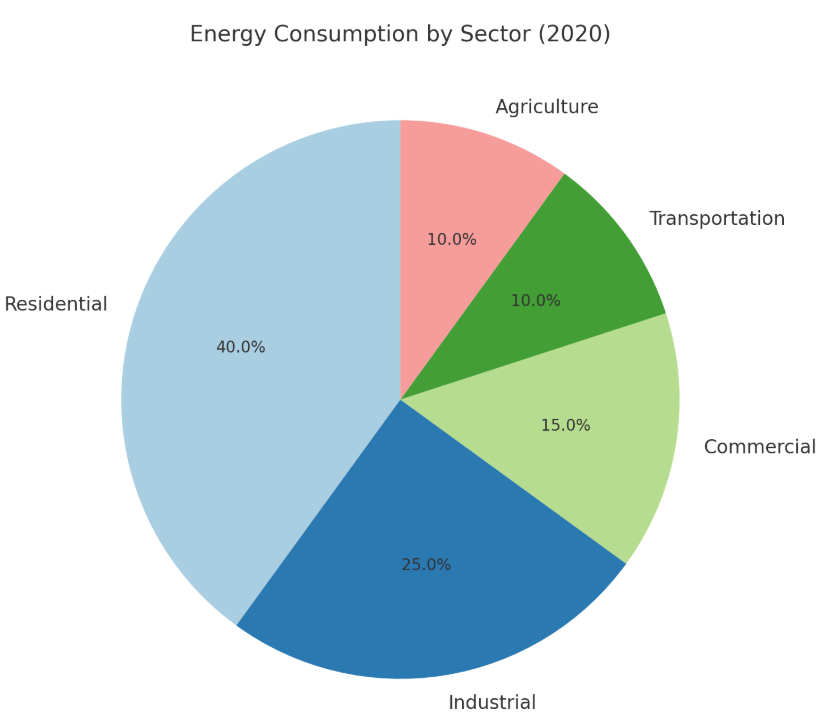
The pie chart depicts the distribution of energy consumption across five sectors in 2020: residential, industrial, commercial, transportation, and agriculture.
The residential sector accounted for the largest share of energy consumption at 40%, followed by the industrial sector with 25%. The commercial sector used 15%, while the transportation and agriculture sectors each consumed 10%.
The dominance of residential energy use can be attributed to heating, cooling, and household appliances, which are staples of modern living. Industrial energy consumption is significant due to the high energy demands of manufacturing and production processes. The commercial sector’s energy use reflects the needs of businesses and offices. The smaller shares for transportation and agriculture indicate less overall reliance on energy in these sectors compared to others.
This data underscores the importance of improving energy efficiency in residential and industrial sectors, as they collectively consume the majority of available energy resources. (150 Words)
The bar chart illustrates the percentage of people in different age groups who attended live music concerts in 2021.
The highest attendance was recorded among the 20-29 age group at 80%, followed closely by the 10-19 group at 70%. However, the attendance rates declined steadily with age, with the 30-39 group at 60%, the 40-49 group at 50%, and the 50-59 group at 40%. The lowest attendance was observed among individuals aged 60 and above, at only 30%.
This data indicates that younger people are significantly more likely to attend live music events than older age groups. The steep decline between the 20-29 and 30-39 age groups suggests that life circumstances, such as career or family responsibilities, may influence entertainment preferences. Similarly, the lower attendance among those over 50 may reflect generational differences in musical tastes or accessibility issues. The data emphasizes the importance of targeting younger demographics for live music promotions. (152 Words)
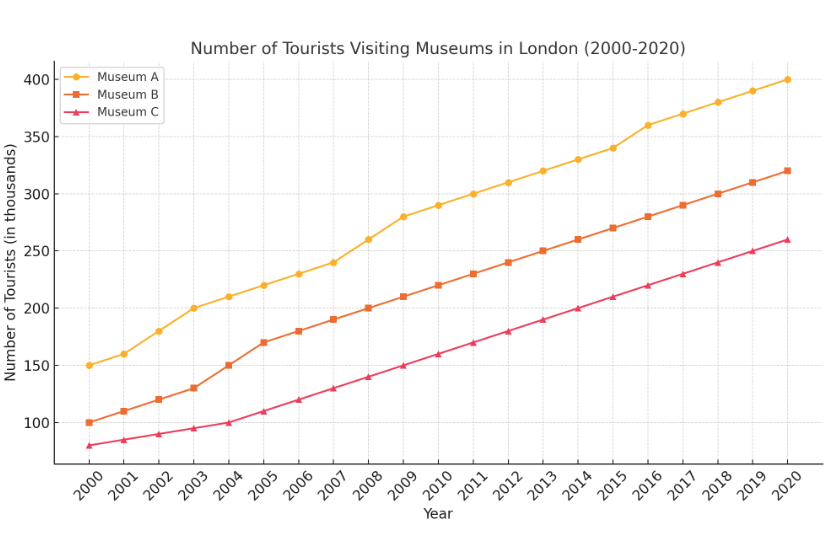
The line graph illustrates the number of tourists visiting three different museums in London—Museum A, Museum B, and Museum C—from 2000 to 2020.
Overall, all three museums experienced an upward trend in visitor numbers over the 20-year period, although the rates of growth varied. Museum A consistently attracted the highest number of visitors, starting at 150,000 in 2000 and steadily rising to 400,000 in 2020. In comparison, Museum B saw a similar upward trajectory, growing from 100,000 to 320,000 over the same period. Museum C began with the lowest visitor numbers at 80,000 but also witnessed significant growth, ending at 260,000 in 2020.
Notably, the gap between Museum A and the others remained substantial throughout the period, although it narrowed slightly after 2010 as Museum B’s growth accelerated. Museum C exhibited slower growth in the early years but experienced a more pronounced increase in visitor numbers from 2010 onwards. This data highlights a growing interest in cultural tourism in London. (161 Words)
サンプル問題 The graph below shows the number of tourists visiting three different museums in London from 2000 to 2020. Summarise the information by selecting and reporting the main features, and make comparisons where relevant.
サンプル問題 The chart below shows the percentage of people in different age groups who attended live music concerts in 2021. Summarise the information by selecting and reporting the main features, and make comparisons where relevant.
サンプル問題 The pie charts below show the proportion of energy consumption by different sectors in 2000 and 2020. Summarise the information by selecting and reporting the main features, and make comparisons where relevant.
サンプル問題 The table below shows the literacy rates in six different countries in 2010. Summarise the information by selecting and reporting the main features, and make comparisons where relevant.
サンプル問題 The diagram below shows the process of producing electricity from solar panels. Summarise the information by selecting and reporting the main features, and make comparisons where relevant.
サンプル問題 The maps below show the layout of a city center in 1990 and 2020. Summarise the information by selecting and reporting the main features, and make comparisons where relevant.
サンプル問題 The charts below show the average monthly rainfall and the percentage of water usage by sector in a certain country. Summarise the information by selecting and reporting the main features, and make comparisons where relevant.
Monarch butterflies undertake one of the most remarkable migration journeys in the natural world, traveling thousands of kilometers across North America every year. Their migration is primarily driven by seasonal changes and the search for suitable breeding and feeding grounds. The migration cycle spans multiple generations, with different groups of butterflies contributing to the overall journey.
In the spring and summer months, monarch butterflies begin their journey northward from overwintering sites in Mexico and the southern United States. They travel to regions in the northern United States and Canada, seeking milkweed plants, which serve as both a food source and a breeding ground. The butterflies lay their eggs on milkweed leaves, ensuring that the next generation has access to nourishment upon hatching.
The northward migration occurs over several generations, each with a lifespan of a few weeks. As the butterflies progress further north, they reproduce and continue the cycle. The final generation to emerge in late summer is unique, as it does not reproduce immediately but instead prepares for the long journey back to warmer climates.
During autumn, the monarchs begin their southward journey. This generation, known as the migratory generation, is physically distinct from the earlier generations. They possess larger bodies and longer wings, which enable them to cover greater distances. Environmental cues such as temperature and daylight guide their navigation towards the forests of central Mexico.
Once they arrive in Mexico, the butterflies cluster in trees to survive the winter months. They enter a state of reduced metabolic activity to conserve energy. This period of dormancy is critical, as it allows them to survive until the return of warmer conditions.
Monarch butterflies face numerous challenges during their migration. Habitat destruction, climate change, and the reduction of milkweed plants due to agricultural expansion pose significant threats to their survival. Conservation initiatives focus on habitat restoration and public awareness campaigns to protect these vital pollinators.
Scientists study monarch migration using various methods, including tracking devices, citizen science initiatives, and genetic analysis. These approaches help researchers understand migration routes, monitor population trends, and identify critical habitats for conservation efforts.
Flowchart Completion Questions
Complete the flowchart below. Choose NO MORE THAN TWO WORDS AND/OR A NUMBER from the text for each answer.
Monarch butterflies leave (1) __________ in spring. ↓
Travel northward in search of (2) __________ plants. ↓
Multiple generations reproduce and continue migration. ↓
The (3) __________ generation begins the southward journey. ↓
Arrive in Mexico and cluster in (4) __________. ↓
Enter a state of reduced (5) __________ to survive winter. ↓
Threats include habitat loss and decline of (6) __________.
Answer Key and Explanation
overwintering sites Hint: Second paragraph. The passage states that “Monarch butterflies begin their journey northward from overwintering sites in Mexico and the southern United States.”
2. milkweed Hint: Second paragraph. Monarchs seek milkweed plants as both a food source and breeding ground.
3. migratory Hint: Fourth paragraph. The passage mentions that the migratory generation is the one that embarks on the journey back south.
4. trees Hint: Fifth paragraph. Monarchs cluster in trees to survive the winter months.
5. metabolic activity Hint: Fifth paragraph. The passage describes how monarchs enter a state of reduced metabolic activity.
6. milkweed Hint: Sixth paragraph. The passage highlights the reduction of milkweed plants as a major threat to their survival.
● ONE WORD ONLY もしくは NO MORE THAN TWO WORDS という語数の指定があります。
例題:
The Effects of Air Pollution on Human Health and the Environment
Air pollution has become a critical issue affecting human health and ecosystems worldwide. It is primarily caused by emissions from industries, vehicles, and agricultural activities, releasing harmful substances like particulate matter (PM), nitrogen oxides (NOx), and sulfur dioxide (SO2) into the atmosphere. These pollutants have far-reaching consequences for both human health and the environment.
One of the most concerning impacts of air pollution is its effect on respiratory health. Fine particulate matter (PM2.5) can penetrate deep into the lungs, causing inflammation and exacerbating conditions like asthma and bronchitis. Long-term exposure to polluted air is linked to severe diseases such as lung cancer and cardiovascular complications. Vulnerable populations, including children and the elderly, are particularly at risk. For instance, studies have shown a significant increase in hospital admissions for respiratory issues during periods of high air pollution.
Air pollution also has a substantial impact on the environment. Acid rain, formed when sulfur dioxide and nitrogen oxides react with water vapor, damages soil, water bodies, and vegetation. It alters the pH of aquatic ecosystems, making them unsuitable for many species. Additionally, the deposition of pollutants on leaves and soil can inhibit plant growth and reduce crop yields. Ozone, a secondary pollutant formed through the reaction of sunlight with volatile organic compounds (VOCs) and nitrogen oxides, is particularly harmful to plant life. High levels of ozone can damage the leaves of plants, affecting their ability to photosynthesize and reducing agricultural productivity.
Another significant issue caused by air pollution is its contribution to climate change. Carbon dioxide (CO2) and methane (CH4), both greenhouse gases, trap heat in the atmosphere, leading to global warming. Short-lived pollutants like black carbon also play a role in heating the atmosphere. Black carbon, produced from the incomplete combustion of fossil fuels and biomass, not only absorbs heat but also accelerates the melting of snow and ice in polar regions.
Efforts to combat air pollution include government regulations and technological advancements. Policies such as the implementation of emission standards for vehicles and industries aim to reduce the release of harmful pollutants. For example, the introduction of cleaner fuels and electric vehicles is helping to lower air pollution in urban areas. Technological innovations like air purifiers and carbon capture systems are also playing a significant role in mitigating the effects of air pollution.
Raising awareness about the dangers of air pollution is crucial for its prevention. Public campaigns and educational initiatives can help individuals adopt eco-friendly practices such as using public transportation, conserving energy, and supporting renewable energy sources. Collaborative efforts between governments, industries, and communities are essential to address this global challenge effectively.
Note Completion Task
Complete the notes below. Choose ONE WORD ONLY from the passage for each answer. Write your answers in boxes 1-6 on your answer sheet.
Effects of Air Pollution on Health:
Fine particulate matter can cause (1) __________ in the lungs.
Long-term exposure is linked to diseases like lung cancer and (2) __________ complications.
(3) __________ populations are especially at risk, including children and the elderly.
Environmental Consequences:
Acid rain damages (4) __________, water bodies, and vegetation.
High levels of (5) __________ inhibit plant growth and reduce crop yields.
Black carbon contributes to the melting of (6) __________ in polar regions.
ーーーーーーーーーーーーーーーーーーーーーーーーーーーーーーーーーーーーーーー
Answer Key
inflammation
Hint: Paragraph 2 describes how fine particulate matter causes inflammation in the lungs.
Reason: Inflammation is a direct consequence of PM2.5 exposure, as mentioned in the text.
cardiovascular
Hint: Paragraph 2 links long-term air pollution exposure to cardiovascular complications.
Reason: This is a specific disease category associated with air pollution effects.
vulnerable
Hint: Paragraph 2 highlights that vulnerable populations, such as children and the elderly, are at greater risk.
Reason: “Vulnerable” is the term used to describe these groups in the passage.
soil
Hint: Paragraph 3 discusses how acid rain affects soil, water bodies, and vegetation.
Reason: Soil is explicitly mentioned as one of the elements damaged by acid rain.
ozone
Hint: Paragraph 3 explains the harmful effects of high ozone levels on plants.
Reason: Ozone inhibits photosynthesis and agricultural productivity.
ice
Hint: Paragraph 4 refers to how black carbon accelerates the melting of snow and ice in polar regions.
Reason: Ice is explicitly mentioned as being affected by black carbon.
4. Diagram Completion(図表完成)
特徴:
イラストや図表が与えられ、それを基に空欄を埋める。
形状や位置関係、説明文を理解する力が求められる。
攻略法:
図を分析: 図のラベルや注釈を確認して、全体像を把握する。
位置関係を意識: 空欄が図のどの部分に対応するかを明確にする。
関連語句を抽出: 図とテキストの対応箇所を正確に見つける。
例題:
Diagram of a Water Cycle:
Evaporation
Precipitation
Question: Label the diagram using NO MORE THAN TWO WORDS.
解答ヒント:
テキスト内で”evaporation”と”precipitation”の間に当たる段階を探す。
“After evaporation, condensation occurs as water vapor cools.”という記述があれば、答えは”Condensation”。