

IELTS Writing Task 1 評価基準(band descriptors) Band 7 の1つを見てください。
“Presents a clear overview of main trends, difference or stages.”
Band 7 では、出題されるグラフ、表、図解(Diagram)、地図(map)の概要を説明する際、trends, difference or stagesを明確に表現することが求められます。
概要(Overview)は、グラフや図解(Diagram)、地図(map)などが示す特徴のことで、Introduction中で必ず書くようにしましょう。
今回は、概要の中で「stages」を明確に表現する方法について解説していきます。
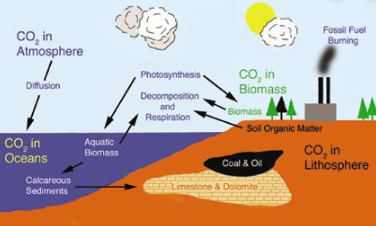
図解や地図の出題は比較的まれ(約15%)です。
確率が低くても遭遇する可能性がありますから、準備は必要です。
ありがたいことに、その準備は比較的簡単です。というのも、通常は評価したり
比較すべきデータがなく、見たままを表現するだけでよいからです。
Stages ― Diagram(図解)と概要表現例
┃問題例

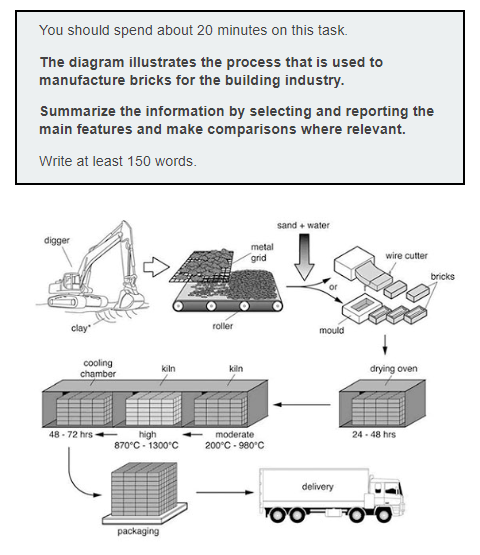
▮ 回答例 Introduction the Diagram
The diagram explains the way in which bricks are made for the building industry.
ご覧のように質問文からの引用です。しかしながら質問文をコピーするのではなく、
受験者自身で言い換え(paraphrasing)をしています。

Introduction (with overview 概要) the Diagram
The diagram explains the way in which bricks are made for the building industry.
Overall, there are eight stages in the process, beginning with the digging up of clay and culminating in delivery.
Introduction の中に、Diagram(図解)の概要(overview)を必ず書くようにしてください。